Table 1 presents last nowcast of SimdiTahmin.com, last nowcast of professional forecasters and actual unrevised data for the reference period. Table 2 shows absolute errors for SimdiTahmin.com, absolute errors for professional forecasters and difference of absolute errors between them. Positive values for difference of absolute errors indicate that Simditahmin.com outperform professional forecasters.
Table 1. Last nowcast of SimdiTahmin.com, last nowcast of professional forecasters and actual unrevised data for the reference period.
|
REFERENCE PERIOD |
PROFESSIONAL FORECASTERS |
SIMDITAHMIN.COM |
ACTUAL |
|
2014 3. QUARTER |
2.9 |
2.1 |
1.7 |
|
2014 4. QUARTER |
2.2 |
2.8 |
2.6 |
|
2014 ANNUAL |
2.7 |
2.8 |
2.9 |
|
2015 1. QUARTER |
1.6 |
2.6 |
2.3 |
|
2015 2. QUARTER |
3.5 |
2.4 |
3.8 |
|
2015 3. QUARTER |
2.7 |
2.9 |
4.0 |
|
2015 4. QUARTER |
4.8 |
3.1 |
5.7 |
|
2015 |
3.8 |
3.4 |
4.0 |
|
2016 1. QUARTER |
4.4 |
4.1 |
4.8 |
|
2016 2. QUARTER |
3.3 |
3.1 |
3.1 |
|
2016 4. QUARTER |
2.4 |
0.6 |
3.5 |
|
2016 |
2.3 |
1.7 |
2.9 |
|
2017 1. QUARTER |
3.8 |
4.5 |
5.0 |
|
2017 2. QUARTER |
5.4 |
5.4 |
5.1 |
|
2017 3. QUARTER |
9.2 |
6.4 |
11.1 |
|
2017 4. QUARTER |
7.1 |
7.7 |
7.3 |
|
2017 |
7.3 |
7.5 |
7.4 |
|
2018 1. QUARTER |
6.9 |
7.4 |
7.4 |
|
2018 2. QUARTER |
5.2 |
6.0 |
5.2 |
|
2018 3. QUARTER |
1.7 |
1.7 |
1.6 |
Table 2. Absolute errors for SimdiTahmin.com. absolute errors for professional forecasters and difference of absolute errors between them.
|
REFERANS PERIYOT |
ABSOLUTE ERROR OF PROFESSIONAL FORECASTERS |
ABSOLUTE ERROR OF SIMDITAHMIN.COM |
DIFFERENCE OF ABSOLUTE ERRORS |
|
2014 3. QUARTER |
1.2 |
0.4 |
0.8 |
|
2014 4. QUARTER |
0.4 |
0.2 |
0.2 |
|
2014 ANNUAL |
0.2 |
0.1 |
0.1 |
|
2015 1. QUARTER |
0.7 |
0.3 |
0.4 |
|
2015 2. QUARTER |
0.3 |
1.4 |
-1.1 |
|
2015 3. QUARTER |
1.3 |
1.1 |
0.2 |
|
2015 4. QUARTER |
0.9 |
2.6 |
-1.7 |
|
2015 |
0.2 |
0.6 |
-0.4 |
|
2016 1. QUARTER |
0.4 |
0.7 |
-0.3 |
|
2016 2. QUARTER |
0.2 |
0.0 |
0.2 |
|
2016 4. QUARTER |
1.1 |
2.9 |
-1.8 |
|
2016 |
0.6 |
1.2 |
-0.6 |
|
2017 1. QUARTER |
1.2 |
0.5 |
0.7 |
|
2017 2. QUARTER |
0.3 |
0.3 |
0.0 |
|
2017 3. QUARTER |
1.9 |
4.7 |
-2.8 |
|
207 4. QUARTER |
0.2 |
0.4 |
-0.2 |
|
2017 |
0.1 |
0.1 |
0.0 |
|
2018 1. QUARTER |
0.5 |
0.0 |
0.5 |
|
2018 2. QUARTER |
0.0 |
0.8 |
-0.8 |
|
2018 3. QUARTER |
0.1 |
0.1 |
0.0 |
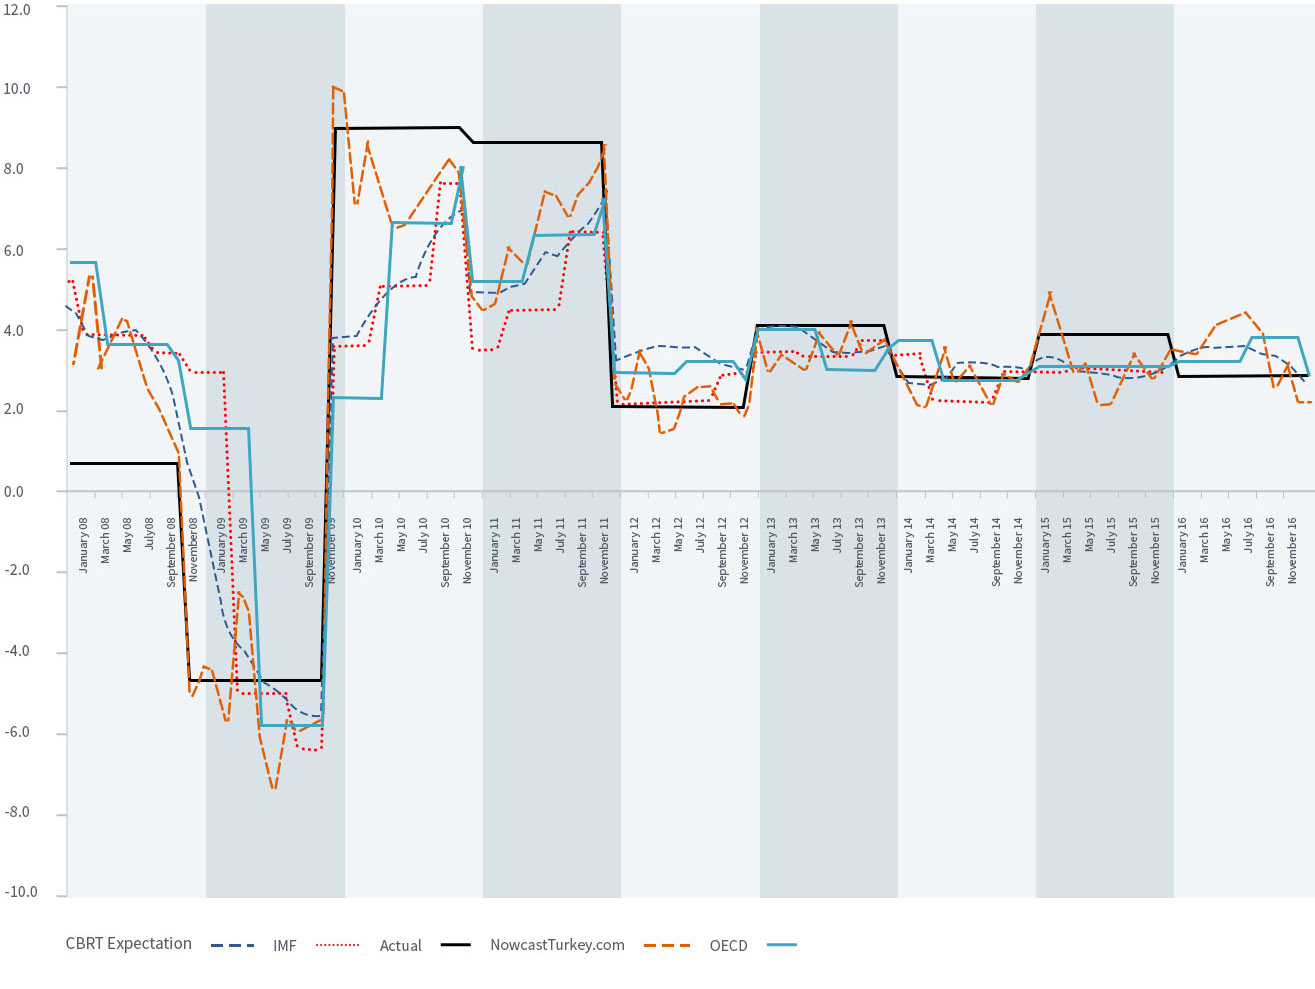
Figure 1 shows the nowcasts of SimdiTahmin.com model using pseudo real-time data set and predictions of the IMF. the OECD and the CBRT’s survey of expectations between 2008-2016.
In 2009. Turkey contracted sharply because of the global economic crisis. Subsequently. Turkey enjoyed a very rapid economic recovery in 2010 and 2011. Institutional forecasts are conservative in these volatile periods. especially in the beginning of these periods. The model of SimdiTahmin.com quickly and efficiently incorporates new information. even though there are a few significant misses in periods around the middle of the year.
Figure 1. Predictions of Simditahmin.com. the IMF. the OECD. the CBRT’s survey of expectations for the reference year.